League of Legends - Analyzing Champion Base Stats
April 15, 2021
My friends and I recently started playing League of Legends. It’s a 5v5 MOBA (Multiplayer Online Battle Arena) game where you play one of 155 champions and work together with your team to destroy the enemy’s base. As my friends and I are new the to the game I thought I would take a look at some of the data the api makes available in order to help understand the game better. First up is making sense of the base statistics and categories of the champions. (If you want to follow along I have a jupyter notebook on my github you can use).
Data Understanding and Exploration
In general each champion has their health (hp), their magic resource (mana/mp), armour, chance for critical hits (crit), attack damage, and attack speed. All of these parameters have a partner stat for the amount they increase each time the character levels up. Additionally there is move speed and attack range which remain constant as the characters level.
As we can see from the histogram of each of the basic stats for all the champions, most follow a normal distribution, but a game with this many characters has several outliers that ignore any general rules.
League of Legends uses 6 classes to identify different champions. Mage, Support, Marksman, Fighter, Tank, Assassin. For new players it can be frustrating to die easily and often. Some classes are inherently more forgiving than others, and my assumption as a new player is that Tank’s would have the highest health and armour, and they would gain the most in these stats as they level.
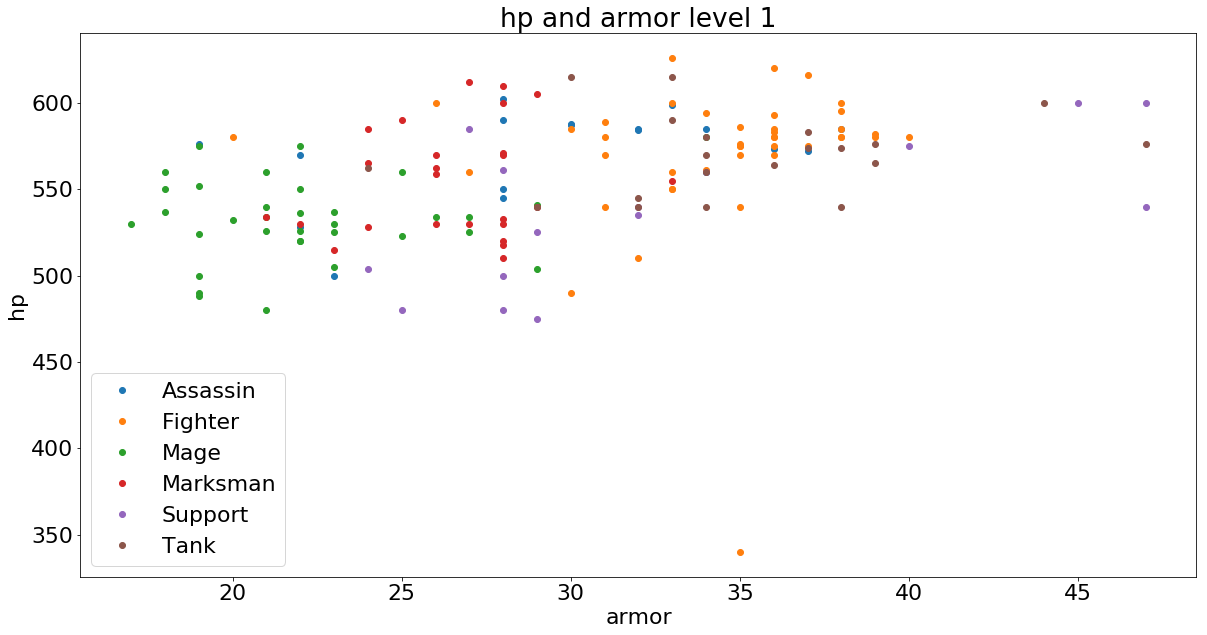
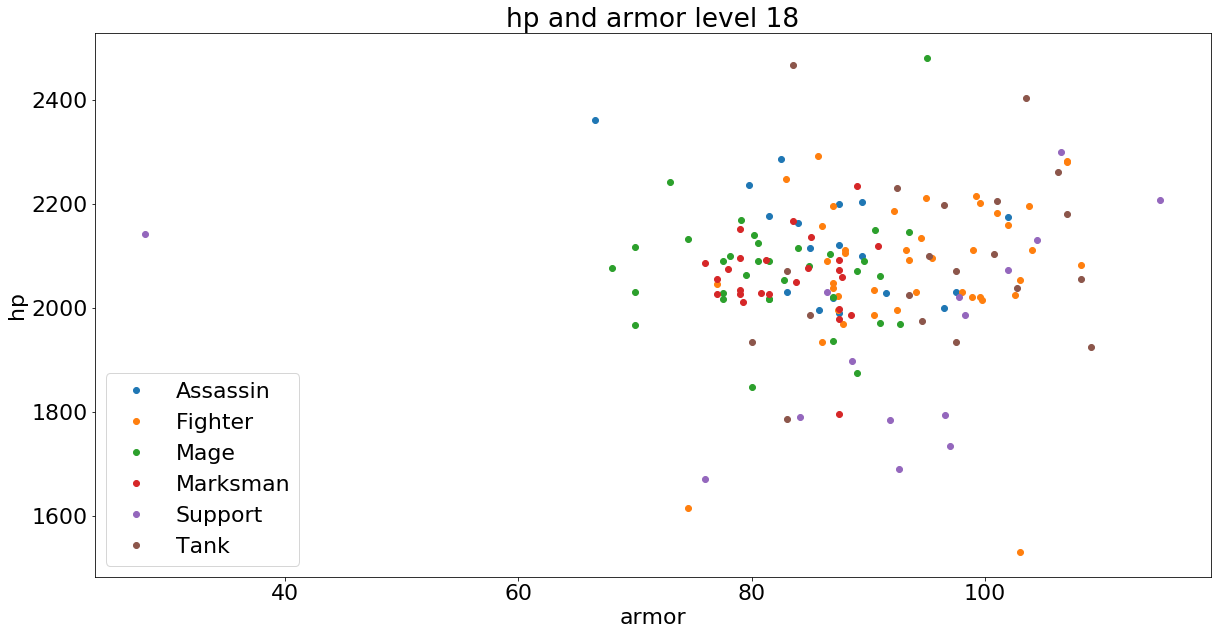
Plotting the health and armour at level 1 and the max level 18 for each primary class doesn’t clearly validate this theory. It is important to note that I’m only using the primary class. 117 of the 155 champions have a secondary class listed that we are ignoring here for simplicity. Due to the complexity of the game our goal isn’t to fully understand every detail of the champions, just enough that at a glance I can look at a champion’s primary class and safely make some assumptions about their base stats.
Another way to analyze how “tanky” champions are is to calculate the average effective hp for each class from their hp and armour values.
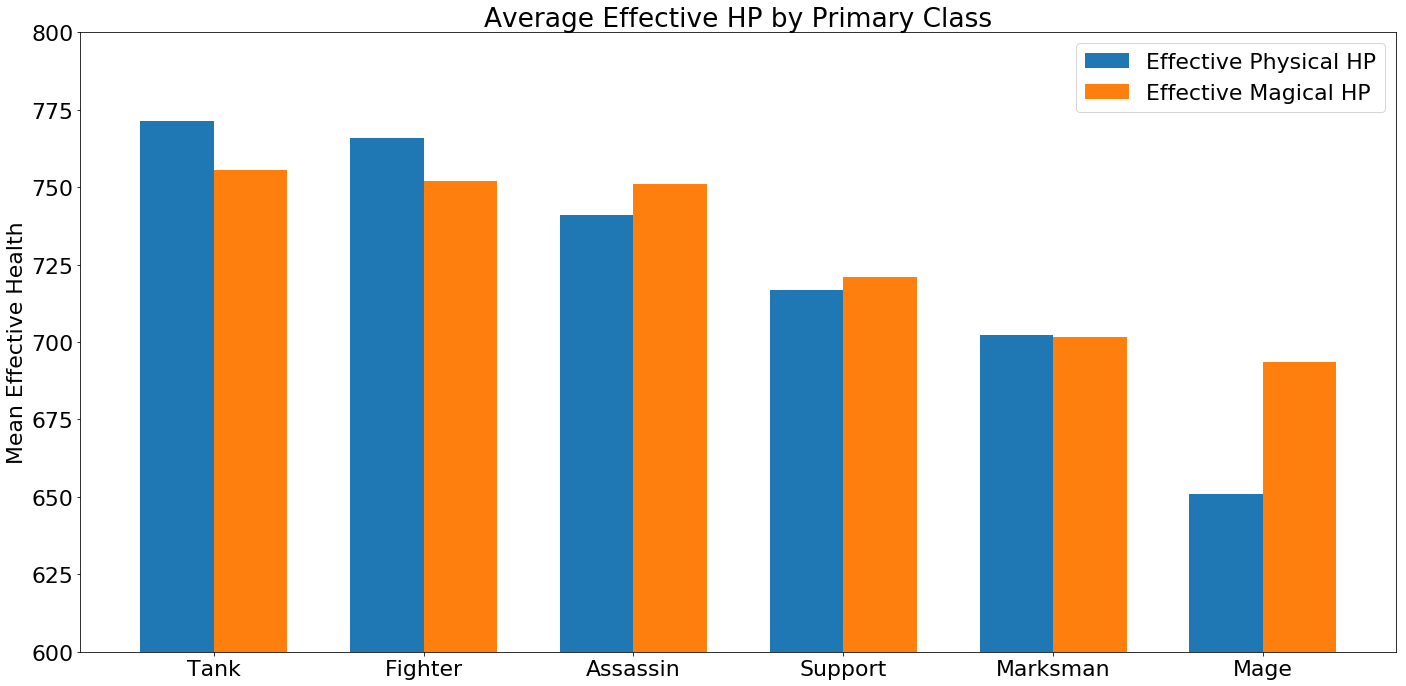
Put simply, effective health is the amount of raw burst physical or magical damage a champion can receive before dying. For physical damage this is calculated using the defending champion’s armour and health. Similarly magic damage is mitigated by magic block and health. (For more on effective health you can look here). Taking the mean of all champions in each class gives us the above graph. Tanks and fighters at the top and squishy mage’s at the bottom. Mages notably deal the most magic damage have the best natural defences to magic (magic block) despite a low health pool.
How hard champions are to kill is interesting, but more exciting is how damage they do. We have attack damage and attack speed in the dataset, and when multiply them together we get damage per second. That is the damage per second the champion deals using only it’s right-click auto-attack at level 1. We can colour the average damage per second by also showing the average attack range for each class.
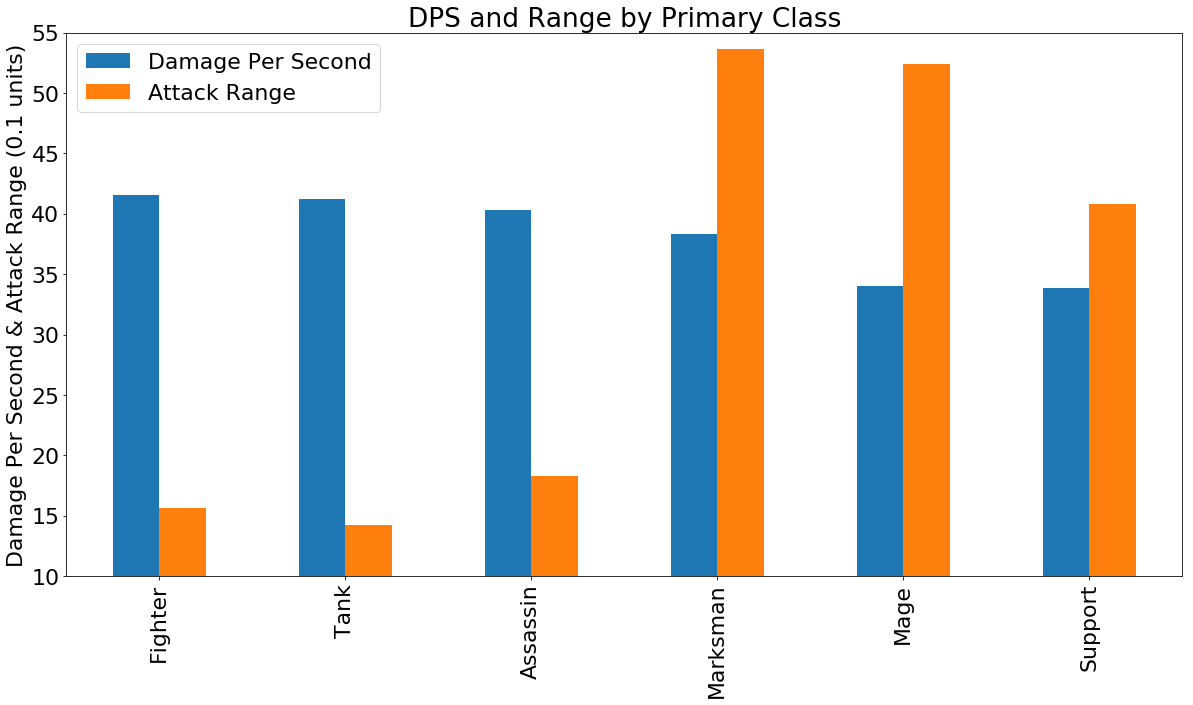 We can see a clear divide here between what appear to be on average melee classes (Fighter, Tank, Assassin) and range classes (Marksman, Mage, Support). The melee classes dish out a higher damage per second (dps), but they can’t do so from a safe distance like their counterparts.
With this first pass over the data, it seems the base stats do a decent job telling a story of what the champion will be capable of. Tanks and Fighters are melee classes that take more damage to kill versus Mages that do good damage from range, but have a lower effective hp.
Logistic Regression
Since the base stats so far seem to do a good job classifying each character, I wanted to see how accurately we could classify each champion using only their base statistics. To do this we’ll take 70% of champions with all the features we’ve used so far, and train a logistic regression model. In the training process each champions stats are compared and the stats that most readily predict their class are given a high weight. After training we can take the randomly assigned 30% of champions we didn’t train on, and apply these weights from our logistic regression model to see how accurately we can classify champions based only on their base stats.
Though the data is mostly ready for immediate analysis, one of the columns (partype) is categorical and tells us what resource, if any, the champion uses for it’s abilities. Most champions use mana, but others may use things like energy or fury. To do this we used one-hot encoding to convert these strings to zeroes and ones that we could use in our logistic regression.
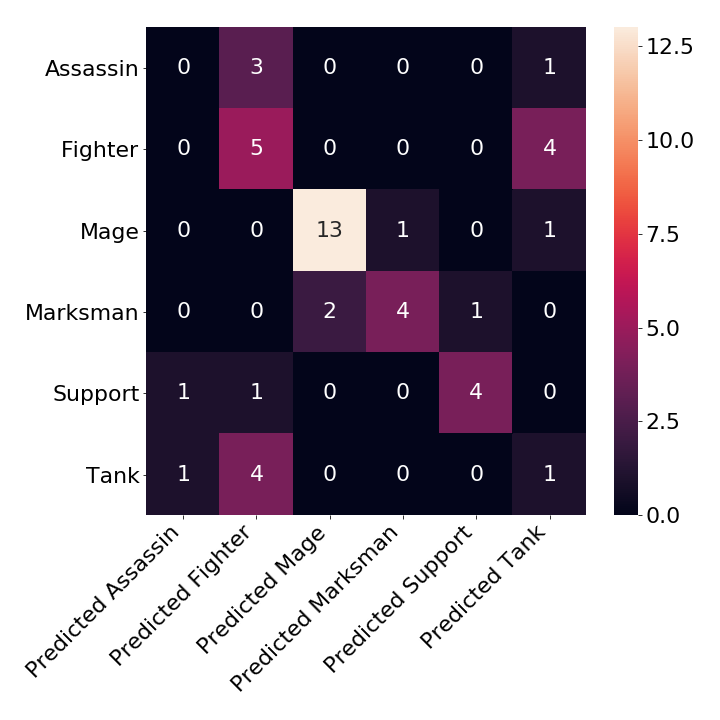
We can see from the confusion matrix of our logistic regression test results that we do a decent job predicting the Fighters, Mages, Marksmen and Supports, but haven’t figured out Assassins and Tanks. If we were 100% accurate with this model we would see zeroes in every cell except for the main diagonal. Printing out the accuracy score we get 66%, and the following classification report.
#Print the accuracy score of the logistic regression
print('Accuracy Score:', round(accuracy_score(y_test, preds),4)*100, '%')

#Create classification report
class_report=classification_report(y_test, preds)
print(class_report)
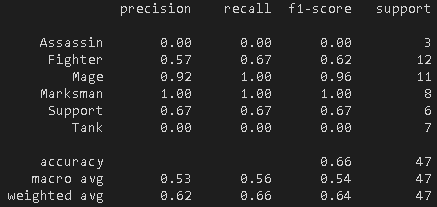
Like we saw from the confusion matrix, we can predict a few classes with good precision and recall, but on average we just aren’t there with this method. One of the advantages of using a logistic regression classifier is it’s interpretability, but with this low of accuracy it doesn’t tell us much. Without going into details the takeaway is that Marksmen and Mages have distinctive base stats (attack range, mana, hp), where Assassins and Tanks vary heavily. This is partially due to the high variety amongst the champions, the huge impact abilities/spells have on the game, and that most champions also have a secondary class.
If the classes themselves aren’t always the best at-a-glance indicator of what a champion might perform like, what other method could we use to get this?
Principle Component Analysis
We could use a Principle Component Analysis (PCA) and see what groups of champions appear. For a detailed explanation of PCA I would highly recommend this youtube video. PCA is used here to extract the most important features in the dataset and boil them down to just 2 general parameters.
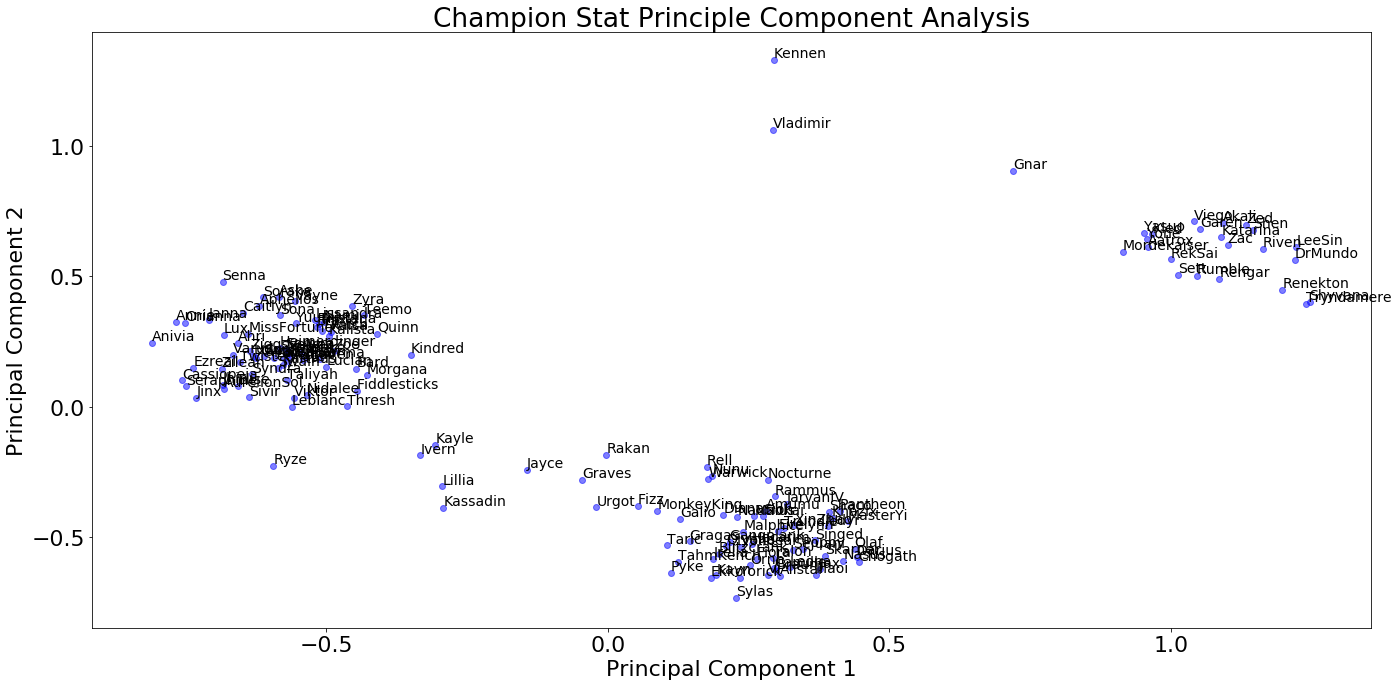
We can see 3 somewhat distinct groups here. I don’t know enough of the champions to understand what the groupings are so we want to look at what features were important in getting us here. If we plot the relative importance of each feature on the graph we get this graph:
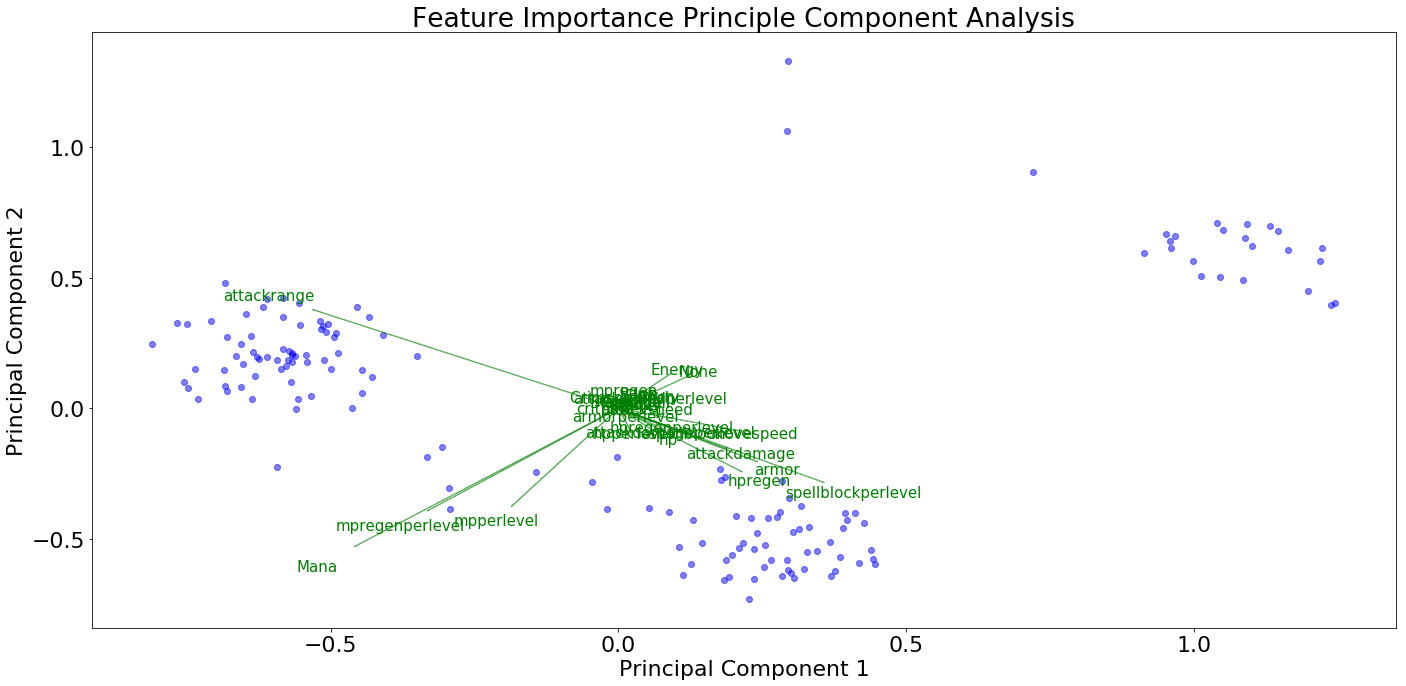
It seems the simplest explanation for the groups are that those in the top right don’t use mana, the bottom middle are melee champions that use mana, and the left champions are mana using ranged champions.
When trying to group champions it looks like whether or not they use mana is important. From my limited experience the mana-users all follow similar rulesets for their abilities/spells while the non-mana users can be very different.
Next Steps
Since base stats only provide us a glimpse at what each champion is capable of, my next post is going to look at how each player can customize their champion with items in game, and the underlying importance of gold.