Regression Analysis for Items and Gold in League of Legends
Continuing my analysis on League of Legends (first post here), I want to talk about items in the game. As a new player one of the things that I feel isn’t well communicated is the importance of getting gold to build items. Items have many effects in the game, but here I’m going to focus on how they alter the base stats of the champions.
If you want to follow along the code is posted (here).
How much do items improve base stats?
Tank
As discussed in my previous post, there are various classes each champion is typed into. The simplest that we will look at first is the Tank. They are generally designed to be your front liners that jump into battle first and absorb as much of the enemies damage as possible to save their squishy teammates. A few minutes into the game a tank might go back to the shop to buy some items. The cheapest item that provides health is called a Ruby Crystal. For 400 gold it boosts the owner’s health (HP) by 150. If we take all the champions in the game that have Tank as their primary or secondary class and average their HP at level 3 plus this cheap item we get this breakdown:

17% of their HP just from a relatively cheap item. Certainly a noticeable increase, and one that could alone have significant impact on the next few minutes of game play.
As the game progresses, gold is accumulated and so are levels. At the end of a long game we can look at what the average level capped (18) tank’s HP is alongside a full item build. League of Legends allows you to equip 6 items, one of them is typically a pair of boots to increase move speed, so we will consider 5 typically purchased items and look at the breakdown again.

We can see nearly half of the average level 18 tank’s HP is now coming directly from items. The Knight’s Vow with its 400 HP increase being the most significant in this build.
Marksman
If we look at the attack damage that the Marksman class does we can see a similar trend of importance of items.
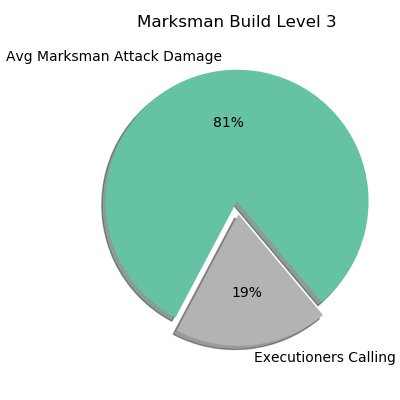

68% of the attack damage the average max-level Marksman does can be from items. Ignoring the other effects these weapons do, the stat boost from items is massive. A champion with more items is more powerful.
How to Acquire Items
Item’s are clearly an important part of a champion’s stats, but the real question is how much they impact the game. To try to understand that we first need to understand how the items are purchased in game.
As a player you gain gold for killing enemy minions, champions, buildings, or neutral monsters. There is also a mechanism for passive gold generation and assisting in kills. This gold has the singular purpose of being used to buy items. This leads to a snowball effect in the game. The more minions killed in the early game, the more early game gold that can be spent on early stat-boosting items to help get more minion kills and eventually more champion and objective kills.
Regression Analysis
Since I want to help my friends and I improve at the game I’m going to look at the data from each of our games, and see how predictive early game gold is in determining the features we care about. Namely champion kills and deaths.
Data Mining and Cleaning
I queried the Riot API for the 32 games I’ve played, and pulled out the relevant information the game captures. I took the amount of damage dealt and number of kills and divided them by the number of minutes the game took to get a comparable feature. The recorded data includes 4 features that aggregate over 10 minute intervals. We’ll use the 0-10 minute interval as our early game indicator and the start of our gold-to-item snowball. The 4 features are:
CS ~ Stands for “Creep Score”, and is the measure of the number of enemy and neutral minions killed.
Damage ~ Amount of damage dealt to minions, champions, buildings and objectives
Gold ~ Amount of gold gained from all sources, more info here
XP ~ “Experience”, which is gained from numerous things and allows champions to level up at specific thresholds.
To improve our model accuracy and give us more information I’ve also added the role and lane that the API classified for each champion. With these categorical entries I used one-hot encoding to analyze them. Due to the unnatural tactics of new players, the game struggles to classify in some instances and classifies the Lane as None. For the Jungle lane a Role is not identified and instead left as None.
With our dataset now ready I randomly pulled out 20% of the champions across all the games and trained a linear regression on the other 80%. To allow for easy interpretation I take the trained coefficients from the regression and multiply them by the values in their respective column of the dataset. This is a way to show the importance of each feature. Since this is a linear regression model, we can interpret the higher absolute value as having a large impact on determining the goal feature. Imagine we had just two features, we could write the regression as:
y = m1x1 + m2x2 + c
If m1x1 is larger than m2x2, it will have a larger impact on y. To scale this up for our our purposes we consider 14 features instead of two, and allow x to represent the array of 256 entries of that feature in the training set. To visualize this we take the resulting dataframe and make a boxplot.
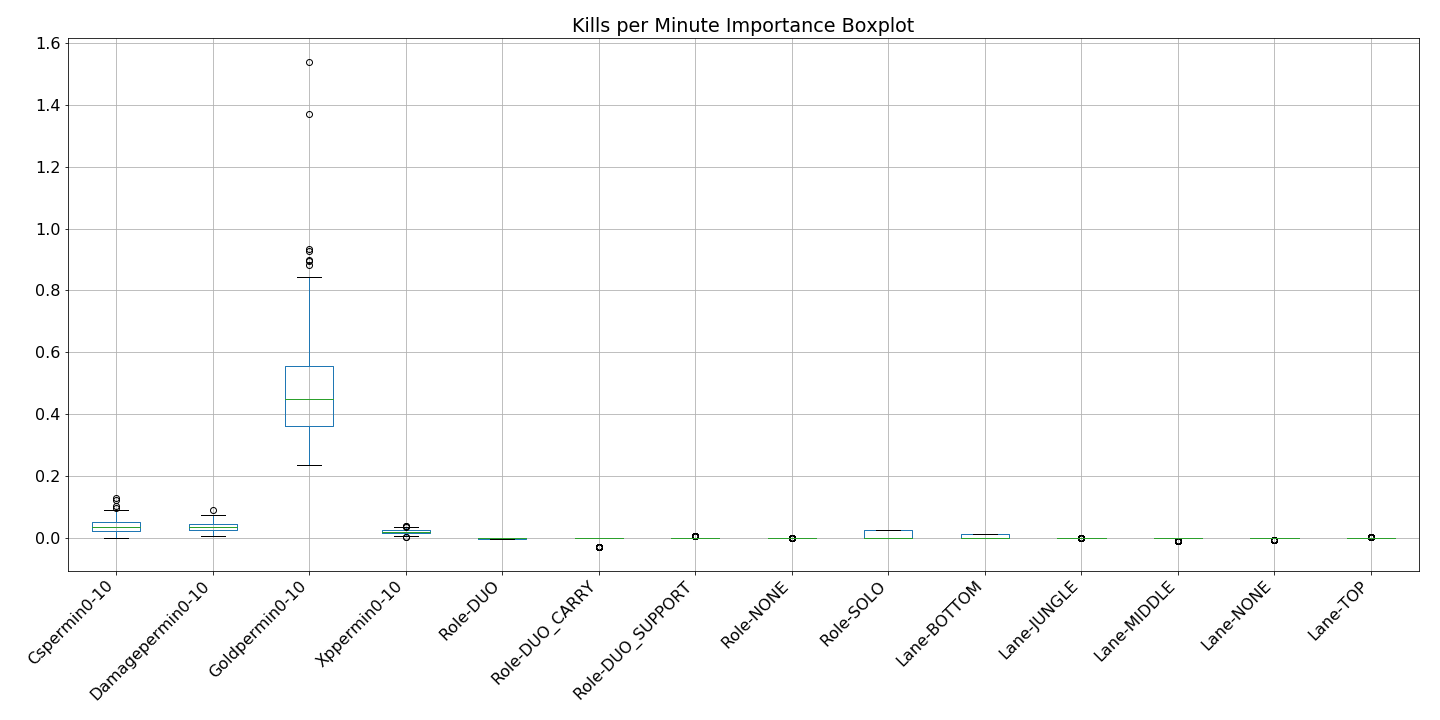
The box of each feature extends to the Q1 and Q3 quartile values of the data with a line in between for the median. The “whiskers” further show the range of the data by extending out to the farthest data point within 1.5*(Q3-Q1). The dots seen above and below the whiskers are outliers.
With this simple visualization we can see that the most important feature here in predicting the number of kills is the early game gold. The gold per minute for the 0-10 minute interval has a much higher absolute value than anything else. This backs up our snowball item theory. The gold generated in the early game can be used for large item buffs to kill the opponent.
If we repeat the same regression for the deaths per minute of the game we see a more convoluted result.
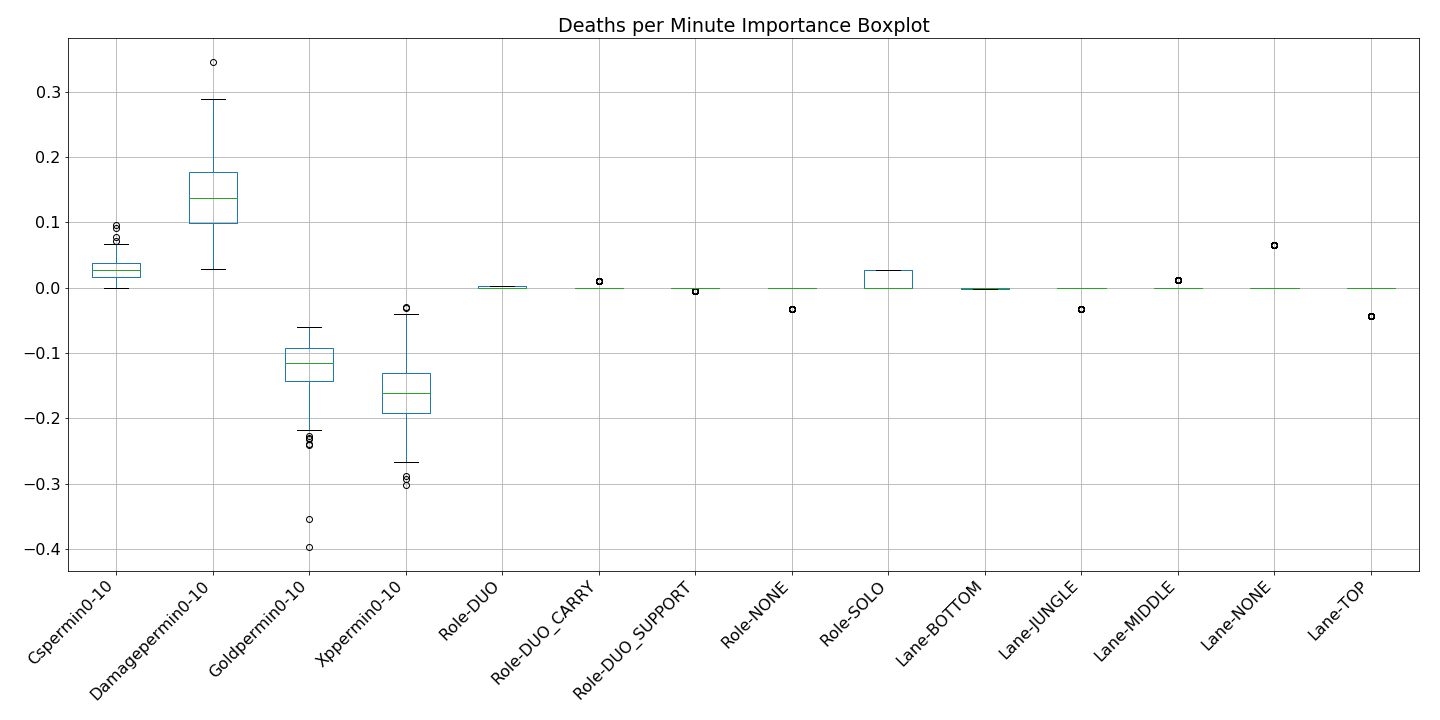
Here we see that having more gold and more experience in the first 10 minutes leads to fewer deaths, but doing more damage results in more deaths. This is further backed up by looking at he correlation heatmap for the features across the whole dataset.
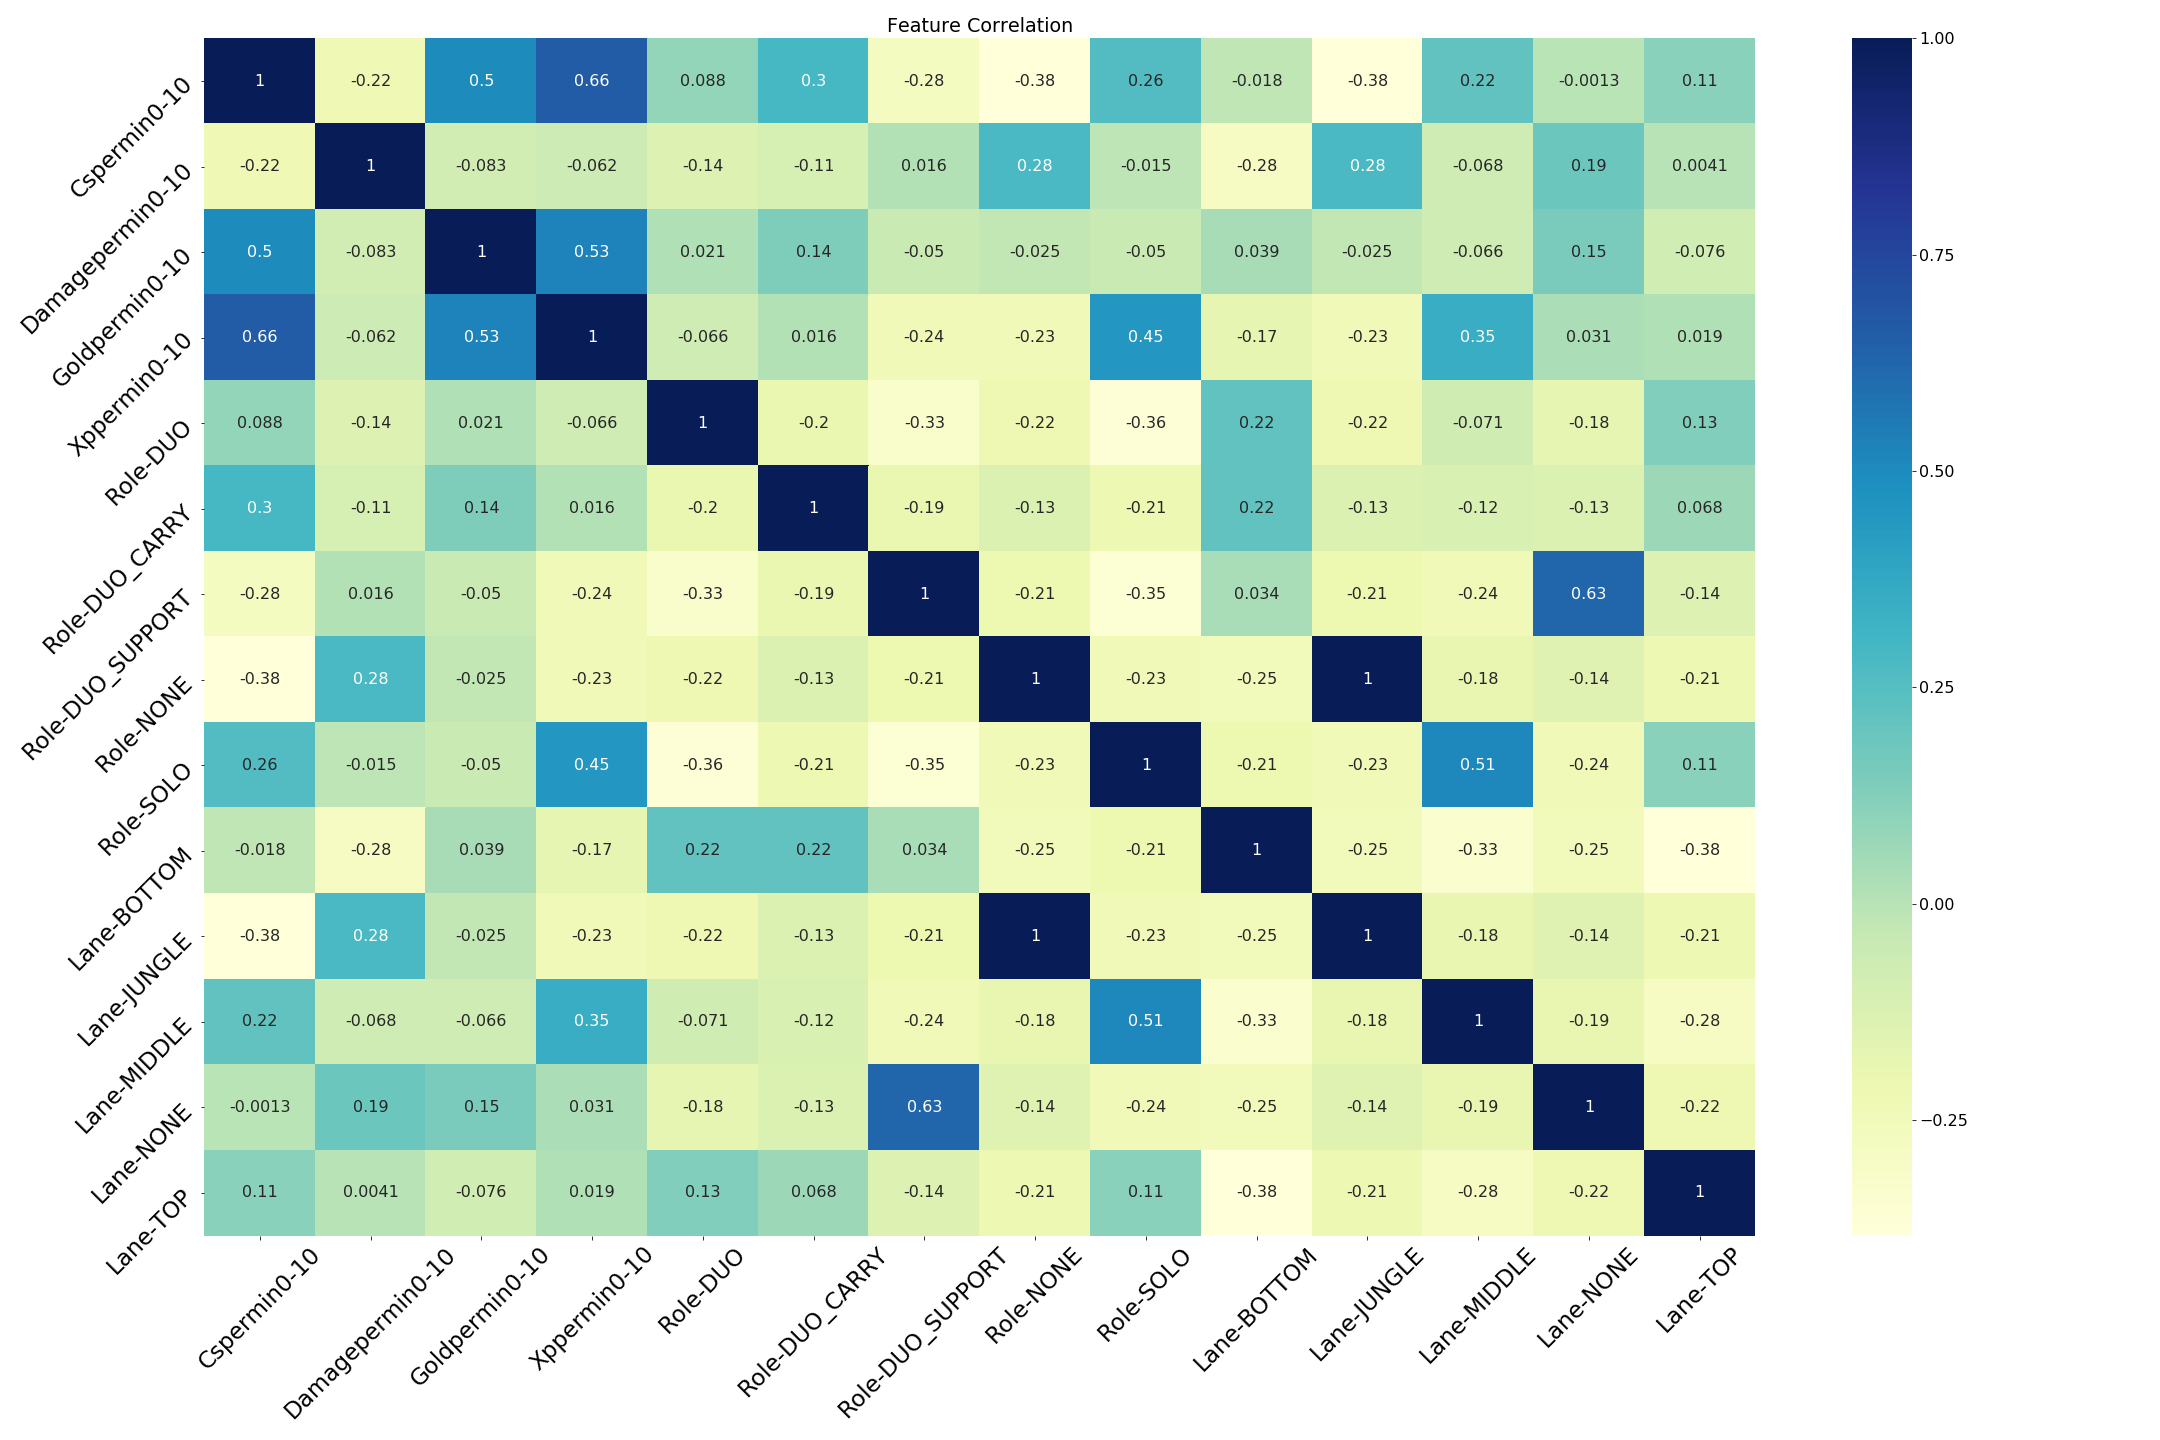
The high early game damage leading to higher deaths is evident here as well showing that early gold and early damage are not correlated. Skirmishing opponents in the early game hurts more than it helps. Likely do to dying unnecessarily when you could be bringing in more gold.
The role and lane features have some interesting patterns, but since they aren’t as significant I’ll avoid discussing them here.
All models are wrong …
Returning to the reason we trained on only 80% of the data, we can use the other 20% to get a gauge of how well these models generalize. If the trained features don’t have a high accuracy on the test dataset, then they may not be good indicators for us to learn from.
The training accuracy score (R2) for the Kills per Minute was 59% while the test accuracy score was 51%. The Deaths per Minute were lower at 47% and 25% respectively.
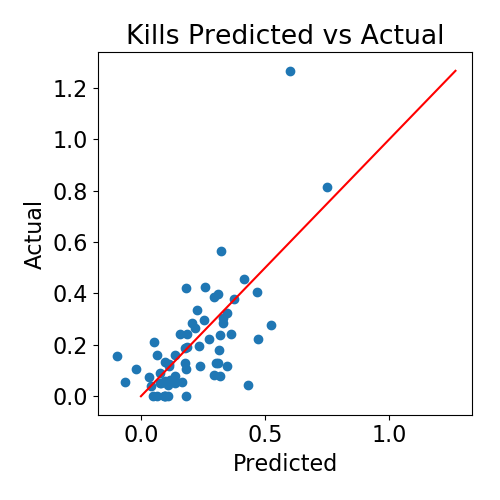
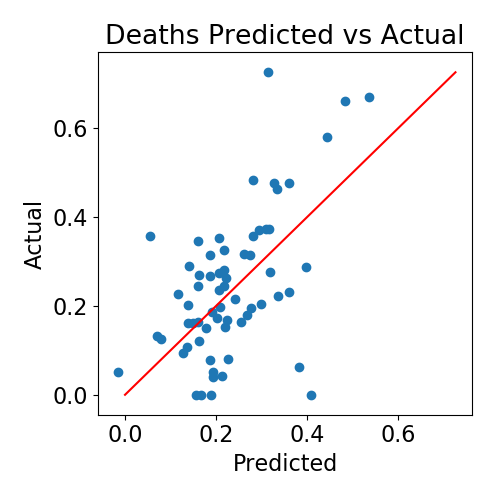
These are poor indicators for goodness of fit, but since we are not using this model to make a highly accurate prediction, it doesn’t matter that much to us. The graphs above show how the model predicts on the test data. The high R2 shows as the data is dispersed far from the red diagonal line, but both reasonably follow the line.
… but some are useful
What we actually care about is identifying patterns in the data. The parameters discussed above (gold/min etc.) are statistically significant in the regression model and the correlation matrix backs up the analysis we did. Though we shouldn’t use this analysis to say that in another one of my games, having X gold per minute in the early game will net Y kills at the end of the game, we can still derive insights from the data.
Next Steps
The next thing I’m interested in looking at it for League of Legends is generating a new champion from the text and images of the current champions. If that is interesting enough I’ll make my next post about it.