Predicting Canadian University Cross Country Performances - Introduction
A project of mine that keeps coming back to me is predicting USport/CIS Cross Country results. During my time at McMaster University I competed on the cross country team and like many of my competitors, enjoyed guessing how the championship races would play out. Most of these predictions are made at the team level, guessing which university will win the team title, and how the other schools will finish. I was involved in many different predictions, but the one I spent the most time on was a full individual prediction of every athlete. The thought process was that in order to better predict each team’s performance, I would look at how the individuals should perform against each other, build out a full simulated race, and then aggregate the individual results to the team level. This worked pretty well, but it relied on some guesswork and some broad assumptions.
Seven years down the road, my data science skills have improved and I wanted to revisit this problem. Predicting cross country results are difficult for many reasons, but before we talk about the roadblocks in our way I’ll give a brief overview on the relevant rules of the sport.
What You Need To Know About Canadian Cross Country
Each September to November (baring global pandemics), Canadian University Cross Country teams participate in meets culminating in a regional and then Canadian championships (USports/CIS). There strictly isn’t anything preventing schools from competing in the championship meets, but most schools only send teams that meet some performance criteria. The placing for each team is determined by the score of the top five individuals. Seven runners are allowed to start in the championship meets, and the sixth and seventh runners are considered displacers. The athlete’s score is based off of the overall place in the race, and the lowest total team score wins (further rules for scoring can be found here). The best possible score would be if one team takes the first five positions, resulting a score of 15 (1+2+3+4+5).

Why is this worth doing?
This is usually a difficult question to ask of any data science project, but like everything I will post on this site, I find this problem fun and interesting. More broadly though I do think this analysis has value in the running community.
The main reason that is currently motivating me to revisit this project is enhancing the spectator experience. I have family members that would come to my races in university, and they would tell me that having the “insider” knowledge I could provide them about who was expected to win, how our team should perform, and some backstory on the favourites greatly enhanced their viewing experience. For a sport that is not considered very spectator friendly, we should be doing everything we can to educate our fans in an effort to improve their engagement.
Another benefit of doing these predictions are the aid they could provide to coaches and athletes. A prediction for a race could be used to give athletes a goal pace to train and race at, as well as show them competitors they should plan to keep up with. Coaches could project how individuals would perform when considering who to enter in the meets, and could analyze the development of their athletes over the years.
A potential side-benefit of this work is the results database that needs to be constructed. There currently isn’t a good place to find Canadian cross country race results. There are websites that host PDF results, but there isn’t an easy way to search those results for an athlete or team. Having one large database would be helpful for statistics and further analysis.
Difficulty in Predicting Results
For many reasons, predicting performances in cross country is very difficult. This is, in my opinion, one of the things that makes guessing how teams or even athletes individually will perform on any given day. The main difficulties I’ve discovered are detailed here.
1. Courses are all different
Each different course has its own elevation profile, number of turns, and terrain. One weekend a team might be climbing big hills on muddy trails with many hairpin turns, and the next race could be a flat hard-packed grass loop. These factors have a huge impact on not just the average time, but some runners perform comparatively better on hills or in mud. To complicate this further, courses can change from year-to-year.
2. Race distances vary
Over the course of the season, races could be from 5km to 10km in length, and are not expected to be precise. The current regulations for the national meet in USports require the length of the course to be within 25m of the 8000m nominal length. The early races in the season have no such requirement, so even the listed distances could be incorrect.
There are many online calculators for scaling running times from one distance to another (examples 1, 2, 3). They work well in the aggregate, but at the individual level, some athletes are better tuned to the shorter distances, while others are better long distance runners.
3. Weather
As the races are done in the in the great outdoors of the Canadian fall, weather of all kinds impacts the runners. Extreme heat, cold, wind, rain, snow and sleet all have a unique effect on the course and the physiology of the runners.
4. Competitive level/number of runners
Some meets have very few teams participating while others can have more than 20. Having more runners in the field increases the competitiveness and provides more running companions. Home meets and championships are often placed as a high priority, with coaches adjusting preparation to have optimal performance, while smaller meets might be used more for a workout.
5. Time in season
Though the season only lasts about 10 weeks, training plans have teams slowly improving throughout the season as they aim to perform their very best at the national championship in November. In other words, we’d expect the same athlete, on the same course, in the same weather, with the same competitors, to perform better on average in November than in September.
6. Events in a season
Most teams compete about every two weeks. Typically they run three or four in-season races, then the regional meet, and finally the Canadian championship. Including the regional meet that is at best five data points we have for each runner.
7. Regions are separated by vast distances
Canada is a big country and budgetary constraints mean most teams stay within their region. Eastern and western teams don’t meet until nationals. With little head-to-head competition, it is difficult to compare performances.
8. Injuries and sickness
The combination of cool weather, start of a school year with interactions of hundreds of other students, the stress of school work, and heavy training load leave athletes ripe for injury and illness. Some athletes miss races, and others underperform.
9. Bad days
Similar, though not necessarily the same as injuries and sickness, are when athletes generally underperform. For tangible or intangible reasons, sometimes things just don’t go according to plan.
10. Athlete Individuality
As I’ve alluded to, each athlete is unique. Though we may have records of athlete’s height and weight, we can’t directly measure their preference for long hilly races, or afternoon races instead of morning ones.
11. Athlete Age
University is often a period of dramatic athletic development. An athlete in their fifth year generally runs faster than they did in their first year. Most athletes are of the same age range, though PhD students can be significantly older.
12. Data
The data itself is another monumental hurdle in this process. Most meets have a record of the performances stored in a pdf, and most of those have been aggregated on trackie.ca. Unless they are from the same timing company, they come in varying formats, with varying degrees of information. Some may give splits, the weather, and age of the runners, but most just list the place, time, runner name and their team. Compiling every race in the history of Canadian university cross country may be impossible at this point, but even putting the last 10 years into a database is no easy feat.
These issues are daunting, and at the very least, bad days will always show up as an error source in our model. That said, for years anecdotal predictions have been made, and are still relatively accurate.
Prediction Evaluation
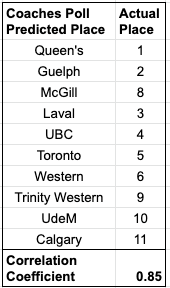
When we reach the end of this blog series I want to be able to prove that I’ve built a good model. One of the evaluation metrics I would like to hit is outperforming the historical pundit prediction rate. I’ll do a longer breakdown in a future post, but a quick scan of previous predictions from coach polls and community rankings show that the top 10 team placings usually have a correlation coefficient of around 0.85. We can see this as the case for the 2019 USports Women’s Coaches Poll below. Most of the predictions were close, but the coaches greatly overestimated the McGill team.

It would stand to reason that the knowledge pollsters use could all be compiled into a database, and then a data-driven approach could produce a more accurate result. I would consider this project a success if the final model produces top 10 team placing predictions at a equivalent or higher accuracy than the polls.
First Step - Course Analysis
My current plan is to essentially walk through each problem identified above and build out a solution for each. With each problem addressed I want to combine the solutions into one model, evaluate its accuracy, and iterate where needed. I hope to post every few weeks with a good-enough solution to each problem, starting with the comparison of each cross country race course.