Who of my friends is the best Go-Karter?
My friends and I recently went Go-Karting, and after four 16 minute races we wanted to know who among us was the overall best driver. One method of doing that would be to look at the place we all came in at each race, assign a point value for each place and sum the points. You could do the same method by taking only the fastest lap from each driver every race. Importantly, neither of these methods take the actual go karts into account. We were able to drive in different karts for each race and had the feeling that some karts were better than others. Some karts skidded more easily, and some felt like that had better engines.
Here is how I went about answering the question of who was the best driver?
Data Preparation
After each race we were handed the printout of our lap splits.
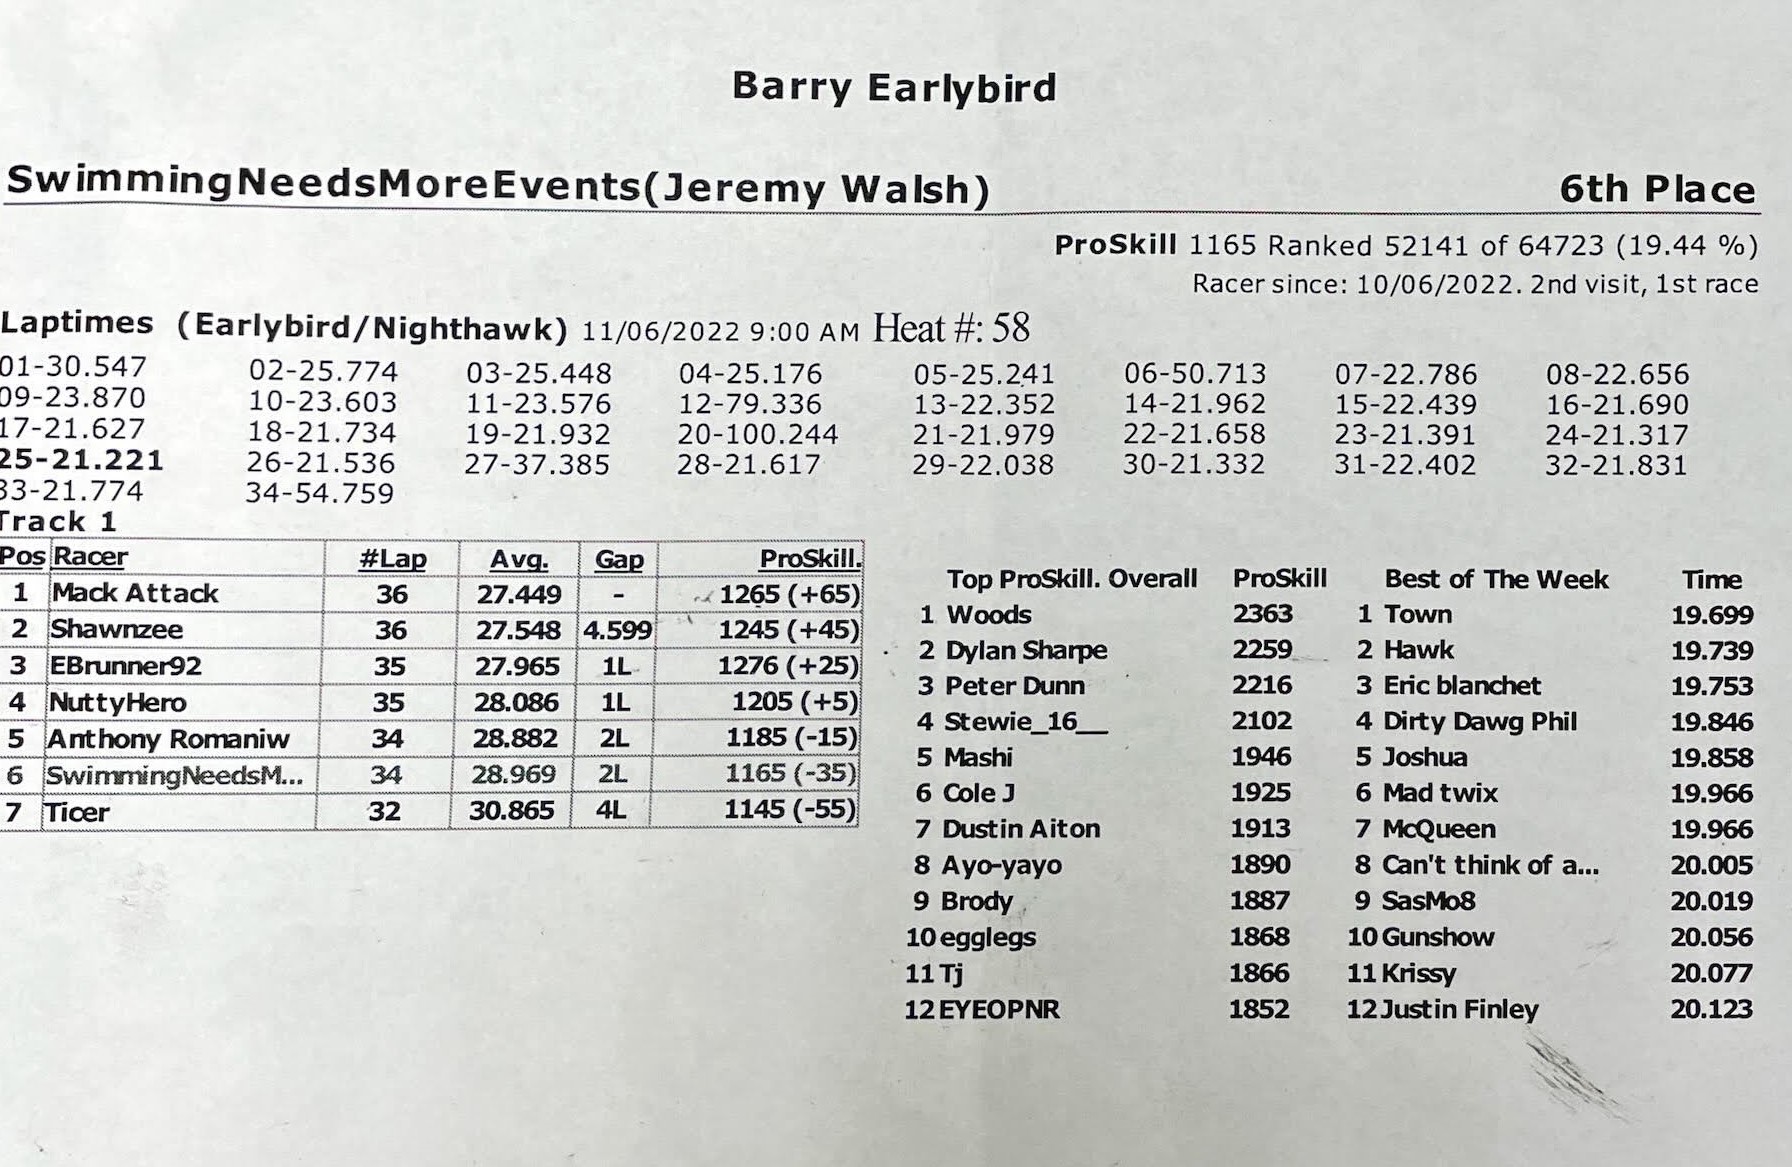
We had 7 drivers in our group over 4 races, so I had 28 sheets of lap splits to ingest. I started reading the lap times in with OpenCV, but then pivoted to Microsoft tools to speed-up this on-off process.
Once I had all the pictures converted to csv’s I realized I was missing the kart numbers. Thankfully the people at the Go Kart facility were able to send me all our kart numbers, and a few of the lap time pictures I was missing.
Race Result Scoring
Driver Scores
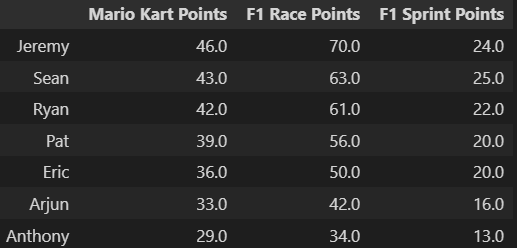
Taking the placings from the driver that went the furthest in the fastest time and then applying Mario Kart or F1 scoring gets similar results. The one difference is the first and second drivers are reversed when using F1 Sprint points.
Assigning points for fastest lap in each race sorts the drivers differently.
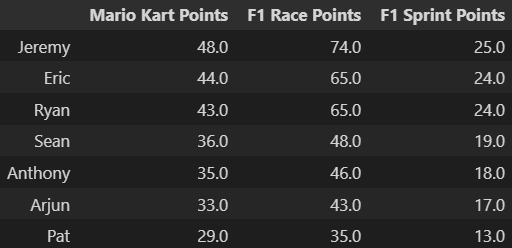
If we wanted to know who the fastest driver was, we may use this ranking, but it misses the racing portion that the finish position can give us.
All of this is assuming our karts were all equal. The feeling we had was that each kart was a little different, but was there a difference in the times for each kart?
Kart Scoring
The karts were randomly assigned by the staff before each race, and most of us got to use a unique kart for each race, with most karts doing 3-4 races.
To determine which karts were fastest I’m just going to look at the fastest lap each kart had.
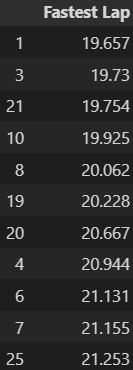
The difference between the fastest kart and slowest was 1.6 seconds, which is 12.5% slower.
Though this seems like a good case we can’t jump to any conclusions yet. The 4 fastest karts were the 4 karts that the top placing driver had. Is that due to the karts being fast, or the driver, or both?
Multivariate Regression
One way to examine who the best driver was is to do a regression on the kart numbers, drivers, times, and whatever other relevant information we can get our hands on and examine the feature importance. A model that accurately fits our data can help to tease apart the relationships.
The dataset I used for the regression analysis included:
- Race Number
- None of us are seasoned go-karters so we improved with each race, especially after the first.
- Start Position
-
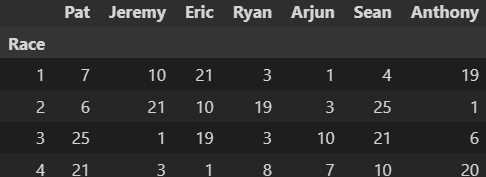
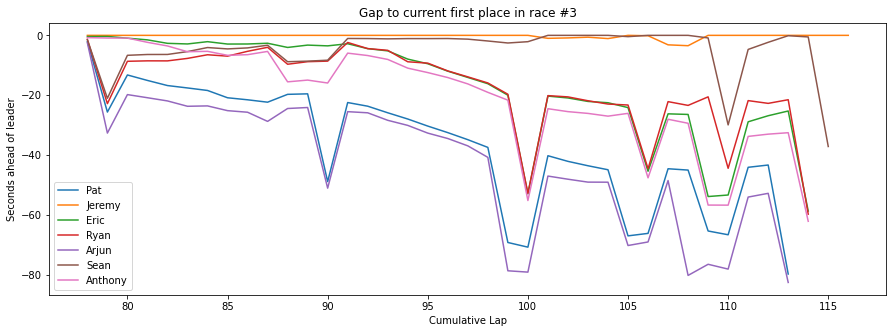
On the small track we raced it was very difficult to pass so starting first was expected to have a large advantage. This can be seen in each race, like here in race 3 were the leaders that got out cleanly went unchallenged, but the highly defensive driver Pat slowed down drivers in behind him, even as they came up to lap him.
-
- Drivers
- Our names one-hot-encoded for interpretation by the algorithm.
- Kart Numbers
- The kart numbers one-hot-encoded to remove any confusion in the algorithm relating to independent kart numbers.
- Filtered Mean Lap
- This is the dependent variable that I’m trying to predict from the data. It is the mean lap time after removing the crash laps that were slower than 40s. It was chosen so as to limit the effect of these outlier laps when we had to stop for a kart to be turned around.
Running a ridge regression against all the data led to an accuracy score of 85%. The high accuracy is partially because the model is overfit and would likely do a poor job predicting future scores. Things like Ryan’s laps not all being sensed in our first race, or the randomness of our first-time racing would be corrected over more races. Given the small amount of data available however, the coefficients seen below can still give us some insight.
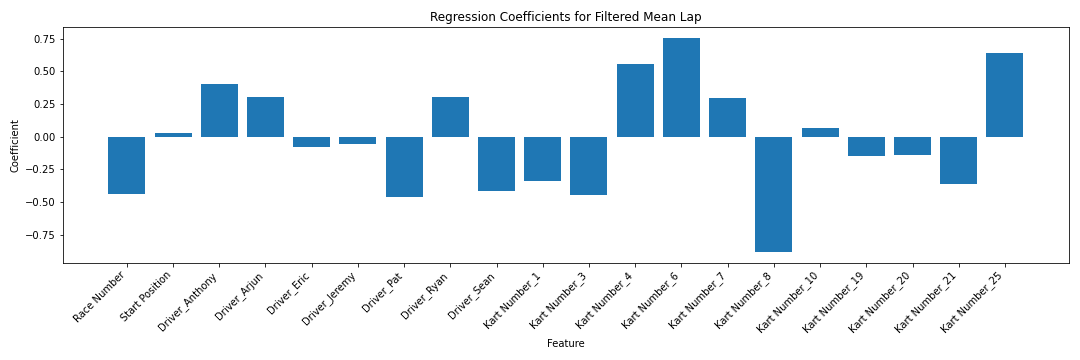
The features that had the most influence on the fastest lap time have the highest magnitude coefficient. A positive coefficient means that feature influences a slower lap time, while a negative coefficient means that feature causes a faster lap time.
Based on this dataset the best Go-Karter was Pat, and if he was put in Kart #8, in a later race of the day we’d expect the combination to dominate.
Conclusion
This analysis shows that karts have a significant impact on the fastest lap time. It also suggests that, despite scoring well, I am not the fastest driver. The model thinks that Pat was able to get more out of slower karts. Personally, I disagree with this conclusion, and will welcome the challenge to get more data in further racing.
The code I wrote for this analysis is posted on my github.